
DSC Perfusion

nordicMEDiVA Perfusion is a centralized hub for perfusion processing, Focusing on automation, quality, standardization and collaboration allowing for higher patient throughput while keeping you in control.
If you have an MRI scanner, chances are you are also doing perfusion imaging. Conventional perfusion analysis pipelines are slow, non-standardized and ineffective.
With nordicMEDiVA Perfusion, you can take this to the next level. It is a centralized hub for perfusion processing, focusing on automation, quality, standardization and collaboration allowing for higher patient throughput while keeping you in control.
Fast Processing with automation
The automatic routing feature in nordicMEDiVA is easy to set up and allows the system to automatically pre-process the raw data before any human looks at them.
The perfusion maps can be automatically exported to PACS or be viewed in nordicMEDiVA’s integrated web-based viewer for further study.
All this can be done within 5 minutes from the patient is scanned.
With our patented normalization method, you can trust the results to come out crystal clear every time. See Patents and Licenses for more information.
Standardization
In nordicMEDiVA, you can define the analysis pipelines and settings organization-wide, making the image analysis pipelines standardized across the organization. You can define multiple pipelines depending on the use case, and even limit who has access to add and modify analysis pipelines.
We follow the recommendations set out by the Quantitative Imaging Biomarker Alliance for DSC imaging. Read more here (external link).
Patented Workflow
To leverage the full potential of automated perfusion, we have patented parts of the perfusion workflow. While the output maps from other vendors often are only qualitative, nordicMEDiVA produces DICOM maps of CBV and CBF that preserve the original geometry and in addition include the actual quantitive parametric values with a predefined color palette. It is thus possible to view the maps on any PACS system or 3rd party DICOM image viewer.
Highly Trusted
We lauched our first software with perfusion capabilities, nordicICE, in 2004. Some independent studies have shown nordicICE perfusion to have equal or higher reproducibility when compared to other perfusion software.
The same perfusion algorithms have been used in nordicMEDiVA perfusion as in nordicICE, and we have done a direct comparison between the two to make sure we are sticking to our high standards.
-

ROI Analysis
A short description with details about the header.
-
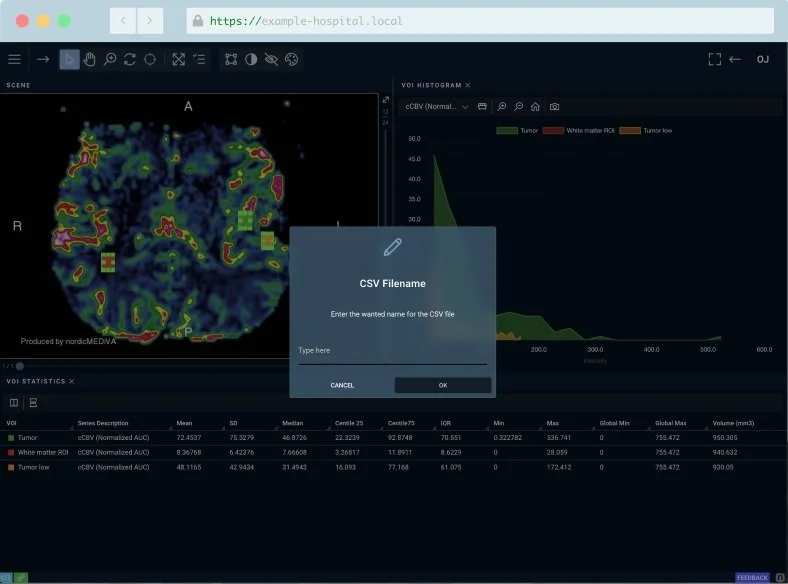
Export ROI Measurements to Excel or CSV
A short description with details about the header.
-

In-app spreadsheet
A short description with details about the header.
More features
-
The advanced motion correction algorithm in nordicMEDiVA can correct for motion up to 30 degrees and has been tested on perfusion data. Motion curves are provided as output for quality control.
-
With nordicMEDiVA Perfusion, you can very quickly generate perfusion maps needed for brain tumor evaluation such as both leakage-corrected and leakage un-corrected CBV and CBF.
-
nordicMEDiVA Perfusion offers two types of leakage correction, including a patented method accounting for variable MTT time.
-
An alternative approach to using AIF deconvolution for perfusion processing is to normalize the perfusion maps to healthy white and grey matter. This eliminates the variability in the choice of AIF and may yield more reproducible results.
This option has been included as standard in the nordicMEDiVA Perfusion package.
-
DICOM maps of CBV and CBF are exported with a color palette and preserve the original geometry of the images. In addition, they include the actual quantitive parametric values. It is thus possible to view and analyze the maps on any PACS system or 3rd party DICOM image viewer.
-
The nordicMEDiVA Perfusion is vendor-neutral and is tested with perfusion series acquired with Siemens, Philips, or GE scanners.
-
Description text goes here
-
As part of the output, nordicMEDiVA produces motion graphs and graphs displaying AIF that should be used for quality control of the data.
Scientific references
Below you will find a list of scientific references, papers, and guidelines we have used in the development of the nordicMEDiVA Perfusion package.
-
Abstract
Dynamic susceptibility contrast (DSC)-based perfusion analysis from MR images has become an established method for analysis of cerebral blood volume (CBV) in glioma patients. To date, little emphasis has, however, been placed on quantitative perfusion analysis of these patients, mainly due to the associated increased technical complexity and lack of sufficient stability in a clinical setting. The aim of our study was to develop a fully automated analysis framework for quantitative DSC-based perfusion analysis. The method presented here generates quantitative hemodynamic maps without user interaction, combined with automatic segmentation of normal-appearing cerebral tissue. Validation of 101 patients with confirmed glioma after surgery gave mean values for CBF, CBV, and MTT, extracted automatically from normal-appearing whole-brain white and gray matter, in good agreement with literature values. The measured age-and gender-related variations in the same parameters were also in agreement with those in the literature. Several established analysis methods were compared and the resulting perfusion metrics depended significantly on method and parameter choice. In conclusion, we present an accurate, fast, and automatic quantitative perfusion analysis method where all analysis steps are based on raw DSC data only.
-
Abstract
The presence of macroscopic vessels within the tumor region is a potential confounding factor in MR-based dynamic susceptibility contrast (DSC)-enhanced glioma grading. In order to distinguish between such vessels and the elevated cerebral blood volume (CBV) of brain tumors, we propose a vessel segmentation technique based on clustering of multiple parameters derived from the dynamic contrast-enhanced first-pass curve. A total of 77 adult patients with histologically-confirmed gliomas were imaged at 1.5T and glioma regions-of-interest (ROIs) were derived from the conventional MR images by a neuroradiologist. The diagnostic accuracy of applying vessel exclusion by segmentation of glioma ROIs with vessels included was assessed using a histogram analysis method and compared to glioma ROIs with vessels included. For all measures of diagnostic efficacy investigated, the highest values were observed when the glioma diagnosis was based on vessel segmentation in combination with an initial mean transit time (MTT) mask. Our results suggest that vessel segmentation based on DSC parameters may improve the diagnostic efficacy of glioma grading. The proposed vessel segmentation is attractive because it provides a mask that covers all pixels affected by the intravascular susceptibility effect.
-
Abstract
This QIBA Profile, Dynamic-Susceptibility-Contrast Magnetic Resonance Imaging (DSC-MRI), addresses the measurement of an imaging biomarker for relative Cerebral Blood Volume (rCBV) for the evaluation of brain tumor progression or response to therapy. We note here, that this profile does not claim to be measuring quantitative rCBV due to lack of existing supporting literature; it does provide claims for a biomarker that is proportional to rCBV, which is the tissue normalized first-pass area under the contrast-agent concentration curve (AUC-TN). The AUC-TN therefore has merit as a potential biomarker for diseases or treatments that impact rCBV. This profile places requirements on Sites, Acquisition Devices, Contrast Injectors, Contrast Media, Radiologists, Physicists, Technologists, Reconstruction Software, Image Analysis Tools and Image Analysts involved in Site Conformance, Staff Qualification, Product Validation, Pre-delivery, Periodic QA, Protocol Design, Subject Handling, Image Data Acquisition, Image Data Reconstruction, Image QA, Image Distribution, Image Analysis and Image Interpretation.
https://qibawiki.rsna.org/images/d/d4/QIBA_DSC-MRI_Stage2-Consensus_Profile.pdf